With so much data being generated everyday, it really doesn't mean anything unless it's been analyzed properly. More data doesn't always mean more revenue.
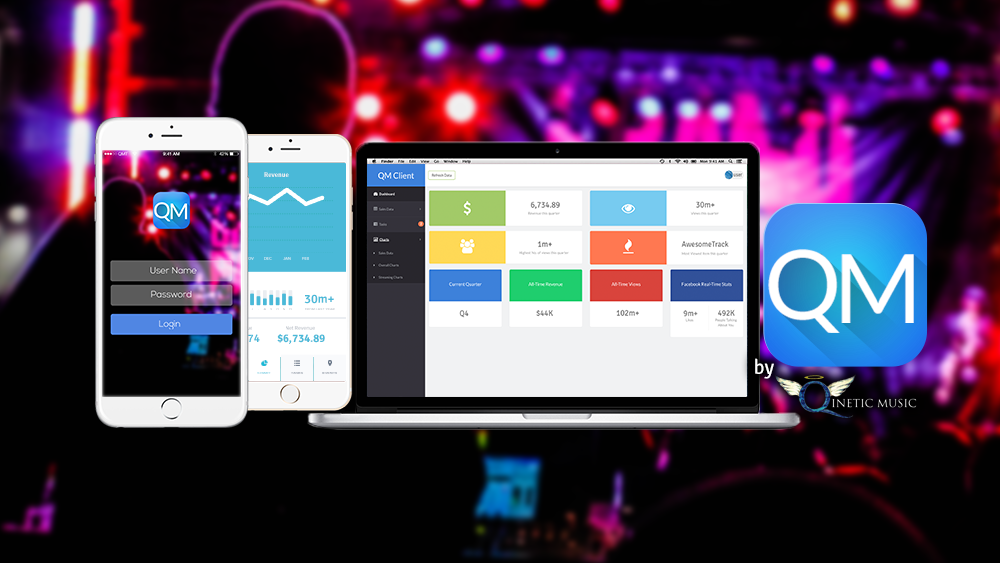
To best analyze and evaluate data we've launched "QM Client". An All Purpose Data Analytics Tool to visualize any data, from social media channels, to E-Commerce sites to website visitors.
Exhibit A: You've recently launched an E-Commerce website, and you have a Facebook page that you're promoting your website with. You can hook up your server to analyze sales reports, identify peak time for sales, and evaluate the ROI of your Facebook page posts and/or sponsored ads. It doesn't end here, you can use the dashboard to send personalized text messages (SMS) to your customers, or schedule posts in Facebook.
Exhibit B: You've recently released an album and distributed through Qinetic Music. Check your sales stats, identify where your listeners are coming from. Anaylze your target demographic. Run targeted ads towards you're demographic and evaluate ROI. Get recommendations of when to post on your social media to reach out to majority of your fan base at the same time.
Exhibit C: You work at an Ad Agency, and you want to research your client's target market. Use the data analytics tool and visualize your client's market reach, demographic, social activities etc. Plan out your project via detailed targeting and analyze the ROI in real-time via social media channels.